Is weight variation a good indicator of chemical resistance?

Niccolò Rivato – ddchem

Epoxy resins are renowned for their exceptional versatility and robust performance across a myriad of applications, from industrial coatings to advanced composites. Central to their widespread use is their remarkable chemical resistance, a feature that ensures durability and longevity even in the harshest environments. This article delves into the critical importance of evaluating the chemical resistance of epoxy systems, highlighting the key features behind a correct testing method.

AN ANALYSIS TO BETTER UNDERSTAND THE RIGHT METHOD FOR EVALUATING CHEMICAL RESISTANCE OF AN EPOY SYSTEM
Epoxy resins are formed through the reaction of epoxide groups with curing agents, resulting in a highly cross-linked polymer network. This network structure imparts significant mechanical strength, thermal stability, and, crucially, resistance to a wide range of chemicals, including acids, bases, solvents, and salts. The inherent chemical resistance of epoxy systems is influenced by several factors, including the type of curing agent used, the degree of cross-linking, and the presence of additives or fillers. Correctly understanding and evaluating the chemical resistance of epoxy systems is paramount for ensuring their performance and reliability in demanding applications. By systematically assessing how these materials withstand exposure to various chemicals, formulators can optimize epoxy formulations to meet specific requirements, thereby enhancing the safety, efficiency, and longevity of the end products. Epoxy resins’ chemical resistance is vital in numerous applications across various industries.
Protective Coatings: Epoxy coatings are used on metal surfaces, concrete floors, and other substrates to protect against corrosion, chemical spills, and environmental degradation, especially in industrial settings like chemical plants and refineries.
Adhesives: In aerospace, automotive, and marine industries, epoxy adhesives are chosen for their ability to withstand exposure to fuels, oils, and other harsh chemicals, ensuring strong and durable bonds.
Composites: Epoxy resins are used in the production of composite materials for high-performance applications, such as wind turbine blades, aircraft components, and sporting equipment, where resistance to chemical attack is essential for maintaining structural integrity.
Marine applications: Epoxy resins are used in boat construction and repair, providing resistance to saltwater, fuels, and other marine chemicals, which is crucial for the durability and safety of marine vessels.
These applications highlight the importance of chemical resistance in ensuring the performance, safety, and longevity of epoxy-based products.

WEIGHT VARIATIN AS A MEASURE OF CHEMICAL RESISTANCE
Chemical resistance testing of epoxy systems based on different standard methods (ASTM D543, ASTM D1308, ISO 2812, ASTM D6943) typically involves scrupulous sample preparation according to standardized protocols (dimension, curing conditions etc) to ensure consistency.

Fig. 1 – Weight variation during a chemical resistance test normally indicates a loss of polymer material due to chemical degradation over time

The samples are then exposed to various chemicals, normally through immersion, with the sample completely submerged in the chemical. The exposure conditions, including temperature, duration, and concentration of the chemicals, are carefully controlled. After the exposure period, the samples should be evaluated for any changes in physical and mechanical properties. However, the standard parameter used to assess the resistance to the chemical is the weight variation of the specimen.
The idea behind the weight variation is that a polymer, submerged in a chemical, will reduce its mass in case the chemical can degrade the polymer during the test (Fig. 1). The weight variation is then used as a direct indicator of the degradation of the polymer: the higher the weight loss during the test the lower the chemical resistance to the chemical. This approach is widely used as a method to evaluate the chemical resistance of epoxy systems; however, it can lead to a misleading evaluation.

IS WEIGHT VARIATION A GOOD INDICATOR OF CHEMICAL RESISTANCE?
The weight variation approach to evaluate chemical resistance assumes that the polymer loses mass over time due to chemical degradation. However, chemical degradation is not the only factor influencing the weight of the specimen during a chemical resistance test (Fig. 2).

Fig. 2 – Chemical degradation and swelling are two possible phases of polymers degradation. The balance between these two phases can create a misleading no-weight variation of the specimen during the test

Absorption of chemicals into the polymer matrix, a phenomenon known as swelling, is an important chemical-polymer interaction that normally increases the mass of the specimen. Swelling is often a preceding stage of polymer degradation. The balance between swelling and chemical degradation can lead to a misleading no-weight specimen variation during a chemical resistance test. Because of these two main effects, the weight of a specimen might seem as unchanged, but the specimen not only has absorbed chemicals into the polymer matrix but is also already degraded. We can conclude that weight variation is not a good indicator to evaluate the performance of an epoxy system during a chemical resistance test.

CHEMICAL RESISTANCE TEST: DDCHEM APPROACH
To evaluate the effect of weight variation, ddchem performed a chemical resistance test based on ASTM D543. The test evaluated the chemical resistance of various curing agents cured with BADGE epoxy resin for 7 days at 23° C. After the curing, the following indicators were measured on the prepared specimen: weight, diameter, thickness, hardness based on ISO 868 – Shore D. Data were collected after 28 days of immersion in various chemicals and compared with the initial data. The difference between the initial data and the data after 28 days of test is reported as a variation %. Figures 3, 4, 5, 6 and 7 show data with various epoxy systems and chemicals.

28-day chemical resistance test in 100% acetic acid. The weight variation average is 7%, the thickness variation average is 24% and the hardness variation average is 68%


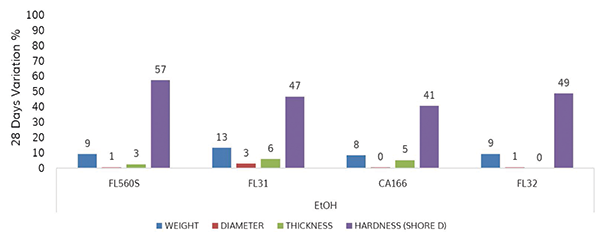
Fig. 4 – 28-day chemical resistance test in 96% Ethanol. The weight variation average is 10%, the thickness variation average is 4% and the hardness variation average is 48%

As we can see, weight variation is often a bad indicator for evaluating the chemical resistance of an epoxy system due to the balance of chemical degradation and swelling of the specimen. Hardness based on ISO 868 is often a better indicator as the hardness variation during the test is normally affected by both chemical degradation and swelling. In some cases, even the thickness variation is a better indicator than weight variation.

Fig. 5 – 28-day chemical resistance test in 30% Hydrochloric Acid


Fig. 6 – 28-day chemical resistance test in 80% Sulfuric Acid


Fig. 7 – 28-day chemical resistance test in 25% Ammonia. The weight variation average is 3%, the thickness variation average is 5% and the hardness variation average is 32%

All the data shown in Figures indicate that relying on a single indicator like weight variation does not provide reliable and trustworthy data for the chemical resistance evaluation. In fact, in many cases, the weight variation under 5-10 % seems to indicate a good chemical resistance of the specimen but the hardness variation over 40-50% for the same specimen indicates loss of mechanical properties and therefore low chemical resistance.

CONSIDERATIONS BEHIND CHEMICAL RESISTANCE TEST
ddchem performed the chemical resistance test (Fig. 8) of its curing agents following ASTM D543. The specimens are cured with BADGE epoxy resin for 7 days at 23° C. Data are collected after 7 days and after 28 days and compared with the initial data. The final score is obtained taking into consideration specimen variations during the test like weight, thickness, diameter and hardness decrease. Also, changes in visual aspects are carefully evaluated during the test. In fact, the visual aspect of a specimen can change dramatically even when other indicators remain unchanged (Fig. 9). A change in visual aspect is then considered as a malus, reducing the final score of the test. ddchem approach to chemical resistance tests does not consider only weight variation but relies on variation of various indicators during the test.

Fig. 8 – Metodo di test della resistenza chimica basato su ASTM D543


Fig. 9 – La variazione dell’aspetto visivo viene attentamente valutata nel test di resistenza chimica ddchem

This approach is more precise and reliable resulting in a better evaluation of the chemical resistance of an epoxy system.